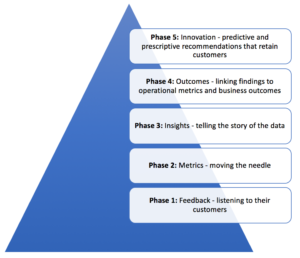
In The Continuum of Data-Driven Success, dear friend and colleague, Annette Franz, Founder and CEO of CX Journey, Inc. shares these five phases of customer data-driven success:
Phase 1: Feedback
This is where we see companies in the primitive stages of understanding the importance of data (i.e., they know they need to listen to their customers, oftentimes because everyone else is doing it). But that’s all they do; they check the box to say, “We listen.” And they’re paralyzed by the reams of data that exist within their systems.
Phase 2: Metrics
Here, companies pick up their next bad habit when it comes to customer listening and understanding: they focus on a metric, on making their number, on moving the needle on the score. Doing that rather than using data to improve the customer experience is not really progress, and it’s not really a good thing. When you focus on the metric, you reward the behaviors that move the number, not on those that deliver a better experience. Those former (not latter) behaviors are often the bad behaviors.
Phase 3: Insights
Now we’re starting to make some progress. Companies at this level are interpreting the data, digging for insights, and telling the story of the data. They are making some data-driven improvements, mainly tactical at this point.
Phase 4: Outcomes
Companies realize they cannot just make improvements without linking the findings and the work to be done to operational metrics and business outcomes. They realize they’ll make greater progress and get the resources (human, capital, and more) if they can show that “If we do X, it will impact Y.”
Phase 5: Innovation
Here, we see some real progress! Companies leverage the data and insights they’ve gathered to make significant strategic improvements. They use the data to develop new products that solve problems for customers and help them do some job, and they redesign the customer experience to better meet customers’ expectations.
The important component along each phase is, obviously, the data and what is done with it. What’s critical to that is the way the data is presented to the user who needs to do something with it. There’s definitely an evolution in analysis and reporting as companies mature along the continuum. The output goes from basic descriptive statistics, to metrics and trends, to insights and stories, to ROI and financial linkages, and finally to predictive and prescriptive recommendations that retain customers.
Consider these factors when you’re developing reports and dashboards for customer experience professionals or for those who need to consume customer data in order to improve the experience. The data needs to be presented in a way that’s actionable; more specifically, it needs to tell the user exactly what needs to be done, why, and what the impact of making the change will be.